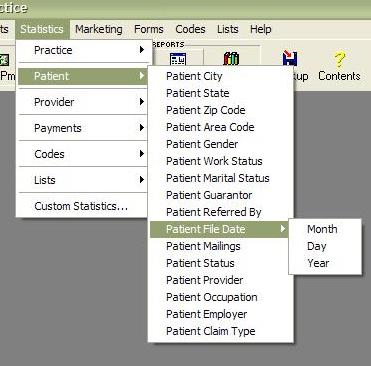
- - Click to view the Patient Statistics sub-menu.
- patient city - click to generate a chart or grid reporting the percentage of your patients residing in each city.
- patient state - click to generate a chart or grid reporting the percentage of your patients residing in each state
- patient zip code - click to generate a chart or grid reporting the percentage of your patients residing in each zip code.
- patient area code - click to generate a chart or grid reporting the percentage or your patients residing in each area code.
- patient gender - click to generate a chart or grid reporting the percentage or your patients that are male or female.
- patient work status - click to generate a chart or grid reporting the percentage or your patients holding different work status.
- patient marital status - click to generate a chart or grid reporting the percentage or your patients that are "single", "married" or "other".
- patient guarantor - click to generate a chart or grid reporting the percentage of your patients who do and do not have a guarantor.
- patient referred by - click to generate a chart or grid reporting the percentage or your patients referred by various means. (ad, newspaper, friend etc.)
- patient file date - click to view the Patient File Date sub-menu.
- month - click to view a chart or grid reporting the percentage of your patients that have filed in each month.
- day - click to view a chart or grid reporting the percentage of your patients that have filed on each day of the week.
- year - click to view a chart or grid reporting the percentage or your patients that have filed on any applicable year.
- patient status - click to generate a chart or grid reporting the percentage of your patients that are "active" or "inactive".
- patient provider - click to generate a chart or grid reporting the percentage of your patients that are under each provider.
- patient occupation - click to generate a chart or grid reporting the percentage of your patients pursuing each occupation you have entered into QuickPractice (lawyer, doctor, student etc.)
- patient employer - click to generate a chart or grid reporting the percentage or your patients working under each employer you have entered into QuickPractice.
- patient claim type - click to generate a chart or grid reporting the percentage of patients filing under each claim type.
|
 |